Atmospheric Influences on Performance Metrics in Multi-Sport Betting Scenarios
Written by Lars Flores · Jun 6, 2026

Atmospheric Influences on Performance Metrics in Multi-Sport Betting Scenarios
Atmospheric conditions shape athletic output across disciplines in ways that directly alter performance statistics used in multi-sport betting calculations, and data from meteorological agencies shows measurable shifts in metrics such as sprint times, endurance thresholds, and error rates when temperature, humidity, and air pressure change. Researchers at institutions including the Australian Institute of Sport have documented how elevated humidity levels above 70 percent slow recovery between high-intensity efforts in both soccer and tennis, while lower oxygen availability at altitude reduces aerobic capacity by up to 15 percent according to controlled chamber studies. These patterns appear consistently in historical match logs from events held between 2020 and 2025, creating repeatable edges for models that incorporate real-time atmospheric readings rather than static venue averages.
Core Atmospheric Variables and Their Documented Effects
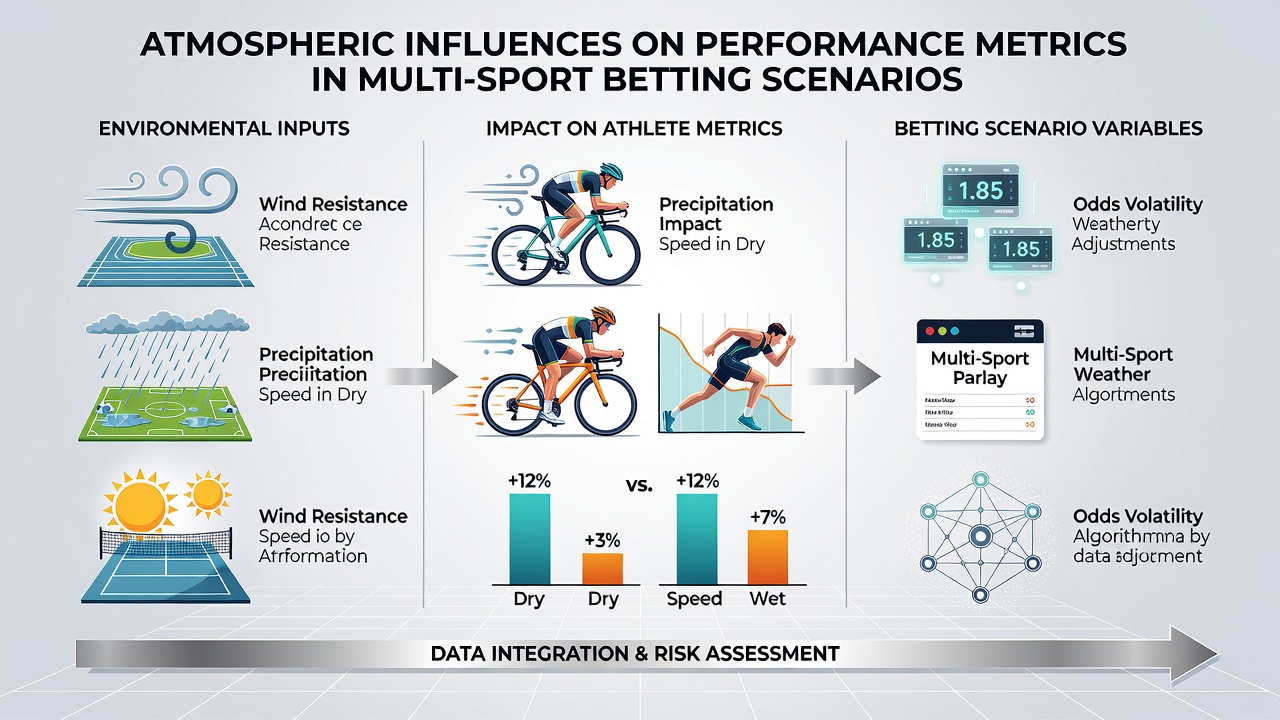
Temperature swings influence muscle elasticity and joint lubrication in track and field events as well as equine athletes, with records from the National Oceanic and Atmospheric Administration indicating that performances in sprints decline when ambient readings exceed 28 degrees Celsius for more than two consecutive hours. Humidity compounds this effect by impairing evaporative cooling, leading to earlier onset of fatigue in prolonged contests such as five-set tennis matches or multi-stage cycling stages that feed into accumulator structures. Air pressure drops associated with incoming weather fronts have been linked to reduced ball flight distances in baseball and golf, altering expected scoring distributions that betting algorithms rely upon when combining legs from different sports.
Wind patterns add another layer because sustained gusts above 15 kilometers per hour increase energy expenditure for runners and cyclists while simultaneously favoring downwind serves in tennis; venue-specific wind roses compiled by Environment and Climate Change Canada demonstrate that certain stadium orientations experience directional biases during afternoon sessions that shift point-win percentages by measurable margins. Observers tracking European football leagues note parallel impacts on long-ball accuracy and set-piece conversion rates during periods of crosswind, patterns that become especially relevant when constructing multi-sport accumulators that mix football with tennis or racing components scheduled on the same day.
Integration Across Sports in Accumulator Construction
Multi-sport betting scenarios require synchronization of atmospheric forecasts because conditions rarely remain uniform across venues separated by hundreds of kilometers, and June 2026 tournament calendars already list overlapping fixtures in North America adn Europe where jet stream positioning is forecast to create contrasting humidity profiles. Models that weight each leg according to localized dew-point forecasts rather than generic venue climatology produce tighter probability distributions, particularly when one component involves endurance-based events sensitive to heat stress and another involves precision tasks affected by air density.
Case analyses of past combined events reveal that altitude differentials between sea-level cricket grounds and highland soccer pitches introduce variance in total goals or run rates that standard deviation calculations often underestimate when atmospheric data is omitted. Progressive stake structures benefit from these adjustments because variance spikes can be anticipated rather than absorbed after the fact, allowing line movements to be monitored against updated weather inputs released by national meteorological services.
Data Sources and Modeling Approaches
Government meteorological archives supply granular hourly observations that sports analytics platforms ingest to recalibrate expected value calculations, while peer-reviewed papers from the European College of Sport Science quantify the interaction between particulate levels and respiratory efficiency in endurance segments. These inputs feed ensemble models that generate revised performance curves for each sport under forecast atmospheric envelopes, and organizations such as the International Olympic Committee have incorporated similar variables into pre-event risk assessments for multi-discipline programs. The resulting adjustments appear in live odds feeds when significant front passages are projected within event windows, creating windows where early positions in accumulators can be evaluated against updated baselines.
Regional differences matter because desert venues experience rapid diurnal temperature drops that stiffen muscle tissue in evening sessions, whereas coastal sites maintain more stable humidity regimes; comparative datasets from the Bureau of Meteorology in Australia and Météo-France illustrate how these location-specific signatures alter injury incidence rates and substitution patterns tracked by performance databases. When such variables are layered into multi-sport frameworks, the covariance between legs decreases because independent atmospheric drivers reduce the likelihood of simultaneous over- or under-performance across unrelated disciplines.
Conclusion
Atmospheric data integration into multi-sport performance forecasting relies on established meteorological records and sports science measurements that continue to refine probability estimates used in betting contexts, and ongoing collection efforts through 2026 will further tighten those linkages across expanding event calendars.