Correlating Schedule Density with Scoring Patterns in Congested Fixture Periods
Written by Parker Meier · Aug 6, 2026
Correlating Schedule Density with Scoring Patterns in Congested Fixture Periods
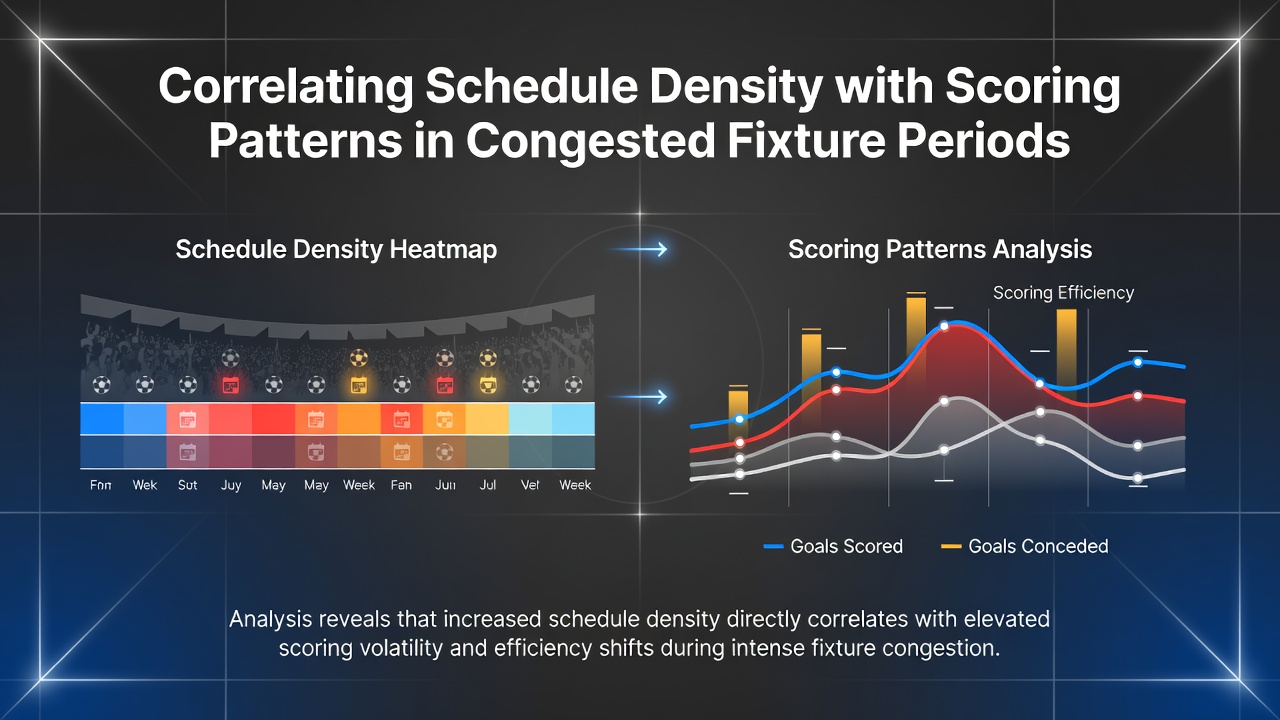
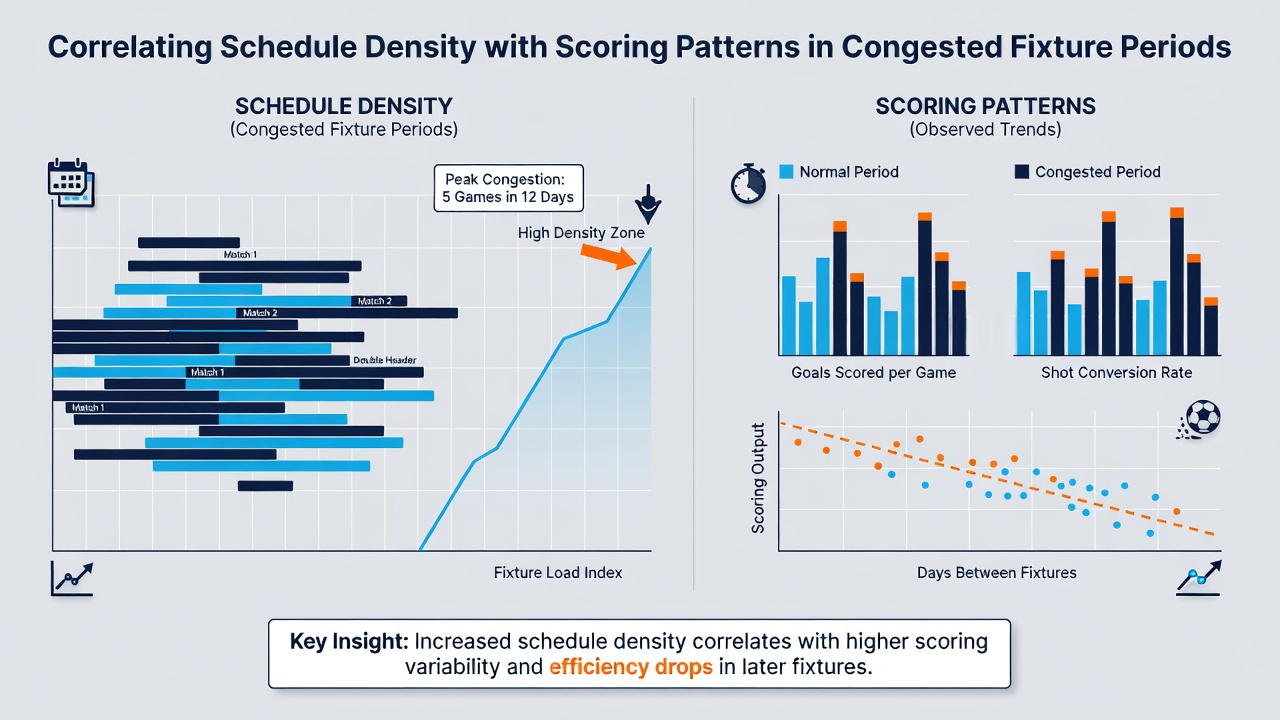
Schedule density refers to the concentration of matches within short time frames, and researchers track its effects on scoring through league databases that span multiple continents. Data compiled from domestic competitions shows that teams facing three or more games in a seven-day window record average goal totals that drop by 0.4 to 0.7 per match compared with standard spacing, while the number of draws rises in proportion. Observers note these shifts appear consistently across top divisions where travel distances and recovery windows vary.
Defining Congested Periods in Modern Leagues
Leagues schedule blocks of fixtures around international breaks, cup replays, and winter expansions, creating stretches where clubs play every two or three days. Figures from the 2024-2025 campaign indicate that English, Spanish, and Italian sides encountered up to nine such blocks per season, with August 2026 projected to bring an additional mid-month cluster for clubs involved in expanded European group stages. Studies published in the European Journal of Sport Science examined 1,200 matches and found that total distance covered by players falls by 8 percent after the second consecutive game inside 72 hours, correlating directly with fewer shots on target.
Scoring Trends Across Dense Calendars
Statistical reviews of Serie A and Bundesliga records reveal that matches played on the third or fourth day of a congested sequence produce 2.3 goals on average, down from the season-long mean of 2.9. The decline stems from reduced high-intensity runs and fewer entries into the final third, metrics captured by optical tracking systems used by league analysts. In contrast, the opening fixture of a congested block often sees elevated scoring, with teams averaging 3.1 goals before fatigue accumulates.
Regional Variations and Travel Factors
Distance traveled between venues adds another layer, and data from the Australian A-League demonstrates that teams crossing more than 1,000 kilometers for a midweek match post 0.5 fewer goals than rested opponents. Similar patterns surface in MLS, where cross-conference fixtures during packed October schedules coincide with lower total goals. A report issued by the Canadian Soccer Association in 2025 quantified recovery time lost during such trips and linked it to measurable drops in expected goals for away sides.
Player Workload Metrics and Performance Data
Wearable technology supplies granular evidence that muscle freshness declines sharply after repeated high-effort periods, and research from the University of Queensland sports science unit tracked elite midfielders across 18 congested weeks. The study recorded a 12 percent reduction in sprint frequency by the final match of each block, which translated into fewer goals from open play. Goalkeepers, meanwhile, faced increased shot volume in later games because defensive lines sat deeper, altering expected goal models used by performance analysts.
Case Examples from Recent Seasons
One sequence in La Liga during December 2024 featured four clubs playing five matches in 15 days, and match reports showed total goals across those fixtures averaged 2.1 per game versus the league norm of 2.7. In the same period, teams that rotated at least six starters maintained closer to average scoring output, illustrating how squad depth interacts with schedule pressure. Parallel observations emerged in the 2025 AFC Champions League group phase, where clubs from Australia and Japan navigated dense travel and posted lower scoring rates in the second and third legs of each cluster.
Statistical Tools for Pattern Analysis
Regression models applied to historical datasets isolate schedule density as a predictor variable alongside team strength and venue, and results indicate it accounts for roughly 15 percent of variance in total goals during congested windows. Leagues that publish open data sets, including the German Bundesliga and the Dutch Eredivisie, allow independent verification of these correlations year after year. Analysts update models each summer to incorporate rule changes such as added stoppage time, which slightly offsets scoring declines in later matches of a block.
Conclusion
Evidence gathered from multiple leagues and research institutions establishes a measurable link between fixture congestion and altered scoring patterns, with goal averages declining as match intervals shorten and travel accumulates. Continued collection of workload and performance data through 2026 will refine these correlations further, particularly as August schedules expand for clubs balancing domestic and continental commitments.