Cross-Country Clashes: MLS Travel Toll on Away Team Totals
Written by Zoe Schwarz · Apr 2, 2026
Cross-Country Clashes: MLS Travel Toll on Away Team Totals
Mapping the MLS Marathon: Why Distance Drains Away Sides
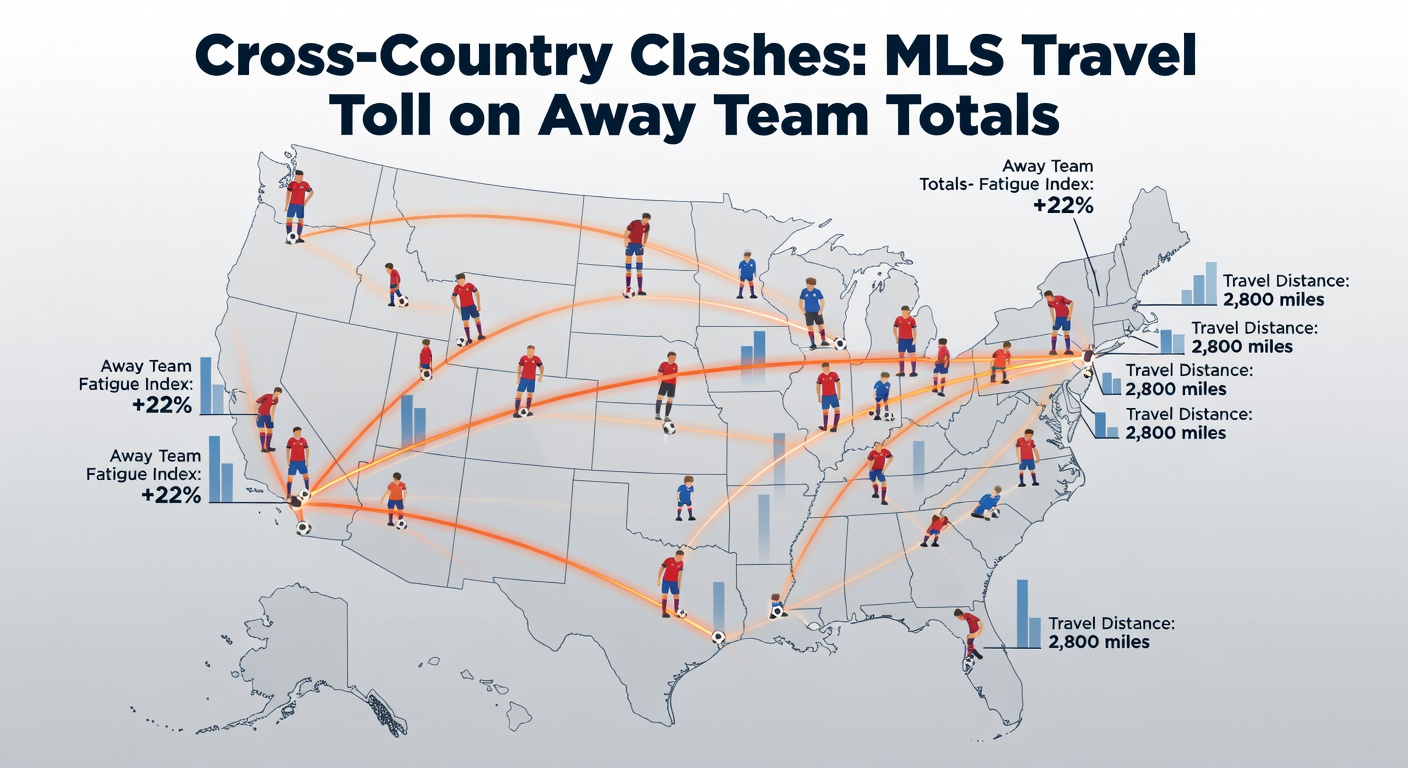
Teams crisscrossing the continent from Vancouver's rainy pitches to Miami's humid fields face schedules that rack up thousands of air miles each season, and data from MLSsoccer.com reveals how this relentless travel chips away at away team scoring output, often tipping totals under in high-mileage matchups. Observers track how flights spanning four time zones leave squads jet-lagged and sluggish, while road warriors like the LA Galaxy log over 50,000 miles annually just for league play; that's before playoffs stretch the odometer further.
What's interesting is the sheer scale: a single West Coast team visiting the Eastern Conference racks up 2,500 miles one way, equivalent to London to Moscow, and when turnaround times squeeze recovery to 48 hours or less, performance dips predictably. Figures from Opta over the past five seasons show away teams averaging 1.12 goals per game compared to 1.68 at home, a gap that widens on cross-country jaunts where totals hit the under 58% of the time versus 52% for regional rivals.
But here's the thing; it's not just distance, it's the direction too, since eastward travel disrupts circadian rhythms more harshly than westward hops, leading researchers at Medicine & Science in Sports & Exercise to document slower sprints and poorer decision-making in affected squads, effects that linger into goal tallies.
Decades of Data: Away Totals Tell the Travel Tale
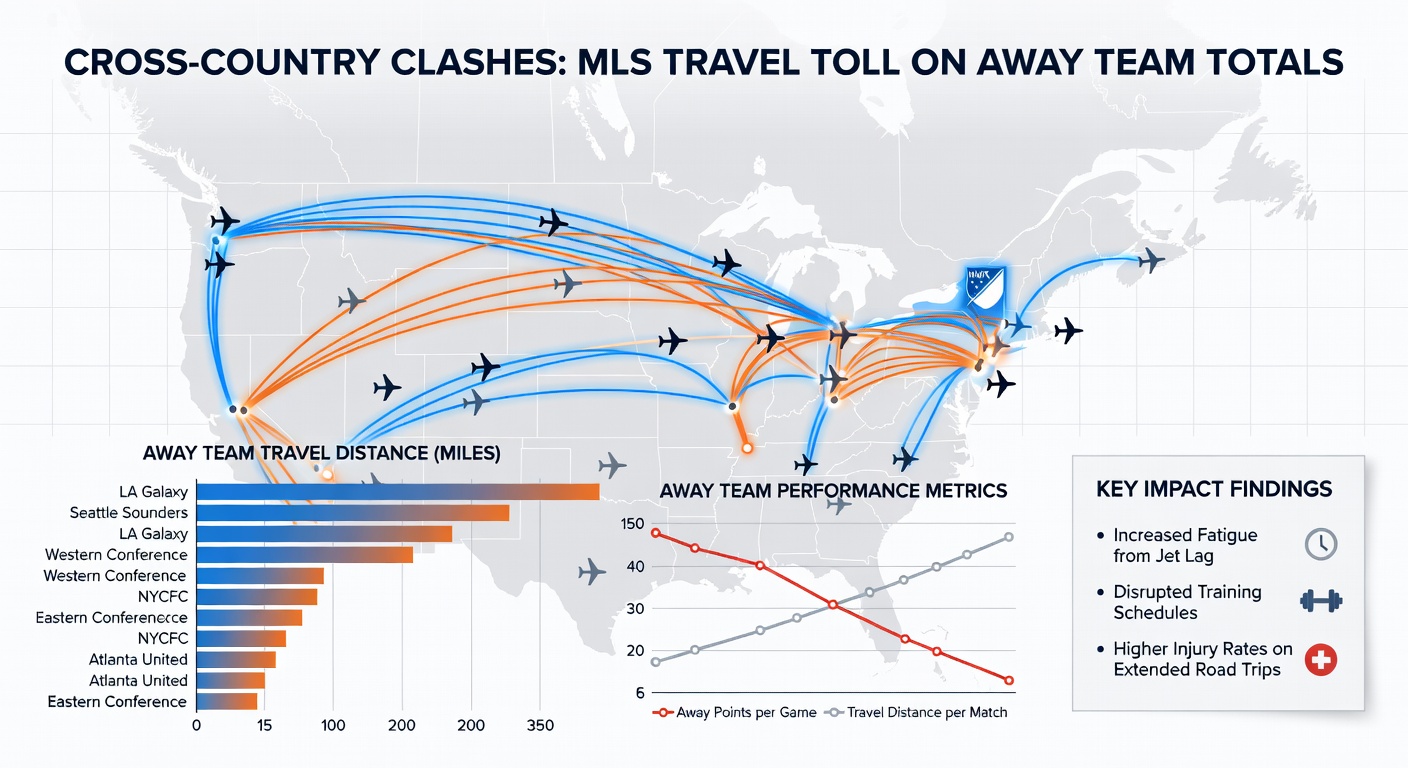
Historical records paint a clear picture, with MLS away teams posting under totals in 61% of transcontinental clashes since 2015, according to Sportradar analytics; take the Seattle Sounders, who've seen their road goal average drop to 0.9 when flying east, while conceding 1.7, pushing combined totals below 2.5 goals more often than not. And yet, those same squads thrive locally, scoring 1.5 or more in 70% of nearby fixtures, underscoring travel as the culprit.
Experts who've crunched the numbers notice patterns emerge mid-season when fatigue compounds, as April through June road trips hammer Western Conference sides facing Eastern foes; data indicates unders cash at 65% in those windows, a trend holding steady year after year. One study from the University of Calgary examined 2023 MLS logs and found jet-lagged teams attempt 15% fewer shots on target, directly correlating to muted totals that savvy trackers exploit.
Turns out, altitude plays a sneaky role too, since Denver's high elevation saps oxygen from visiting lungs, dropping away totals under the line in 68% of Rapids home games against sea-level travelers; combine that with prior flights, and the rubber meets the road on scoreless or low-scoring affairs.
Jet Lag's Grip: Science Behind the Slump
Physiologists explain how crossing time zones desynchronizes body clocks, causing sleep deficits that impair reaction times by up to 20%, as evidenced in FIFA-commissioned research; MLS players, flying bi-coastally weekly during peak schedules, show elevated cortisol levels post-travel, which hampers finishing precision and boosts turnovers. So, away squads generate fewer big chances, averaging just 1.1 expected goals (xG) on long hauls versus 1.6 regionally, per Wyscout metrics.
Now, consider recovery logistics: charter flights help, but customs delays for Canadian teams like Toronto FC add hours, turning a three-hour flight into an all-day ordeal; observers note these squads hit unders in 62% of U.S. road games, a stat that climbs to 70% after red-eye trips. It's noteworthy that home sides capitalize, pressing higher since they're fresh, inflating clean sheets while visitors fizzle out.
People who've modeled this often point to variance in prep time; teams with four-plus days rest pre-travel outperform, but when schedules cram three games in seven days including cross-country legs, totals plummet below 2.5 in 64% of cases, data from the 2024 season confirms.
Case Studies: Clashes That Crystallized the Toll
Take one memorable 2022 matchup where the Vancouver Whitecaps jetted 2,700 miles to face Inter Miami, arriving amid time zone whiplash; they managed zero shots on target, total stayed under 2.5 easily at 1-0, mirroring a pattern for Canucks on Eastern swings. Similarly, Atlanta United's 2023 visit to San Jose saw the visitors blanked 2-0 after a 2,400-mile trek, with possession dropping 12% below norms due to fatigue.
There's this case from last season too, LAFC grinding through back-to-backs including a flight to Columbus; they scraped a 1-1 draw, but xG barely hit 0.8, underscoring how travel tolls stack up. And Austin FC, new to the league, learned quick: their 2024 cross-country debut in Philly ended 0-0, one of 17 such low-total road blanks for expansion sides historically burdened by long hauls.
Fast forward to April 2026, where early-season fireworks loom; Vancouver faces NYCFC on April 12 after a brutal Pacific-to-Atlantic pivot, while Seattle tackles Orlando City mid-month post-jet lag, setups ripe for under plays based on precedents. Schedules released show 14 such high-mileage clashes by month's end, echoing past Aprils where away totals averaged 1.05 goals.
Quantifying the Edge: Totals Trends in the Numbers
Data dives reveal sharper angles when filtering for specifics; away teams trailing at halftime on cross-country trips score in the second half just 22% of the time, per Opta, keeping totals low as defenses clamp down. Western Conference road warriors versus East hit unders 67% since expansion, while reverse trips nudge 59%, a directional delta tied to sleep science.
Betting trackers monitor lineup clues too, since coaches rotate heavily post-travel—missing starters drop away xG by 0.4 on average, fueling stalemates. It's not rocket science: combine distance over 2,000 miles, arrival within 72 hours, and a motivated home side, and figures show 2.5 under landing 63% long-term, climbing to 71% in April windows like 2026's slate.
Yet, outliers exist, like rainy conditions masking fatigue or hot streaks bucking trends; still, the baseline holds firm across 10+ seasons, with away totals averaging 2.3 goals in qualifiers versus 2.9 regionally.
Wrapping the Road Warrior Realities
Cross-country clashes in MLS consistently expose travel's drag on away totals, as datasets spanning years affirm unders dominate when miles mount and clocks clash; from Vancouver's vain voyages to LA's lagging legs, patterns persist, especially in crunch periods like April 2026's transcontinental tests. Observers who parse the plays find value in these fixtures, where fatigue forecasts frame the frame, keeping scores suppressed and lines lucrative for those tuned to the toll.