Mapping Fatigue Indicators in Back-to-Back Scheduling Scenarios for Endurance-Based Disciplines
Written by Lars Flores · Jul 18, 2026
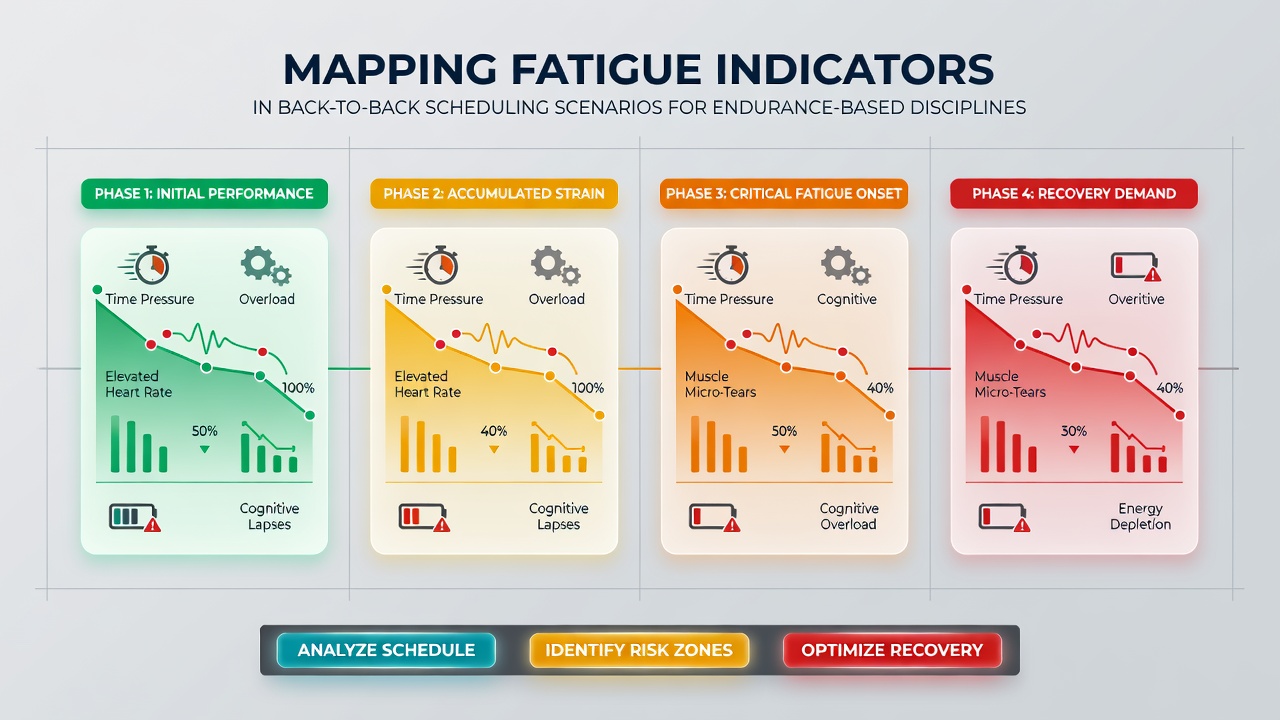
Mapping Fatigue Indicators in Back-to-Back Scheduling Scenarios for Endurance-Based Disciplines
Endurance-based disciplines such as marathon running, road cycling, and triathlon often feature packed calendars that place multiple high-intensity efforts within short recovery windows, and researchers track these patterns to identify how fatigue accumulates across repeated bouts. Back-to-back scheduling appears in professional tours, stage races, and multi-day competitions where athletes must deliver consistent output despite incomplete restoration of glycogen stores, neuromuscular function, and hormonal balance.
Common Patterns in Consecutive Event Structures
Stage races in cycling and clustered marathon weekends illustrate how organizers compress demanding segments into successive days, and data from these formats reveal measurable drops in power output and pace sustainability after the second or third effort. Training blocks that mirror this structure show similar trends, with athletes completing two or more threshold sessions separated by less than 24 hours. Observers note that these compressed timelines amplify cumulative stress on the cardiovascular and musculoskeletal systems, which in turn influences subsequent performance metrics.
Key Physiological Markers Used for Tracking
Heart rate variability remains one of the most accessible indicators because portable devices capture daily fluctuations that correlate with autonomic nervous system recovery, while blood markers such as creatine kinase and interleukin-6 rise in predictable patterns following repeated high-load days. Sleep architecture captured through polysomnography or wearable rings also shifts, showing reduced deep sleep percentages and increased awakenings when athletes face back-to-back demands. Muscle oxygenation measured via near-infrared spectroscopy provides real-time insight into how local endurance capacity declines across successive intervals, and force-velocity profiling tracks reductions in peak power that emerge after the initial bout.
Methods for Constructing Fatigue Maps
Analysts combine longitudinal datasets from training software with laboratory testing to build visual maps that plot performance decay against recovery duration, and these maps often incorporate machine learning models trained on variables including prior load, nutrition intake, and environmental conditions. GPS and power meter files supply granular external load data, while internal load comes from session RPE scores and heart rate integrals. When researchers overlay these layers, clusters of elevated fatigue risk become visible, particularly when rest intervals fall below thresholds identified in controlled studies.
One research team at the University of Ottawa examined triathletes who completed two Olympic-distance events within 48 hours and documented consistent declines in run economy that aligned with elevated serum cortisol levels on the second morning. Similar work conducted through the Australian Institute of Sport has examined rowers in back-to-back regattas, revealing that stroke rate sustainability dropped measurably when sleep was truncated between days.
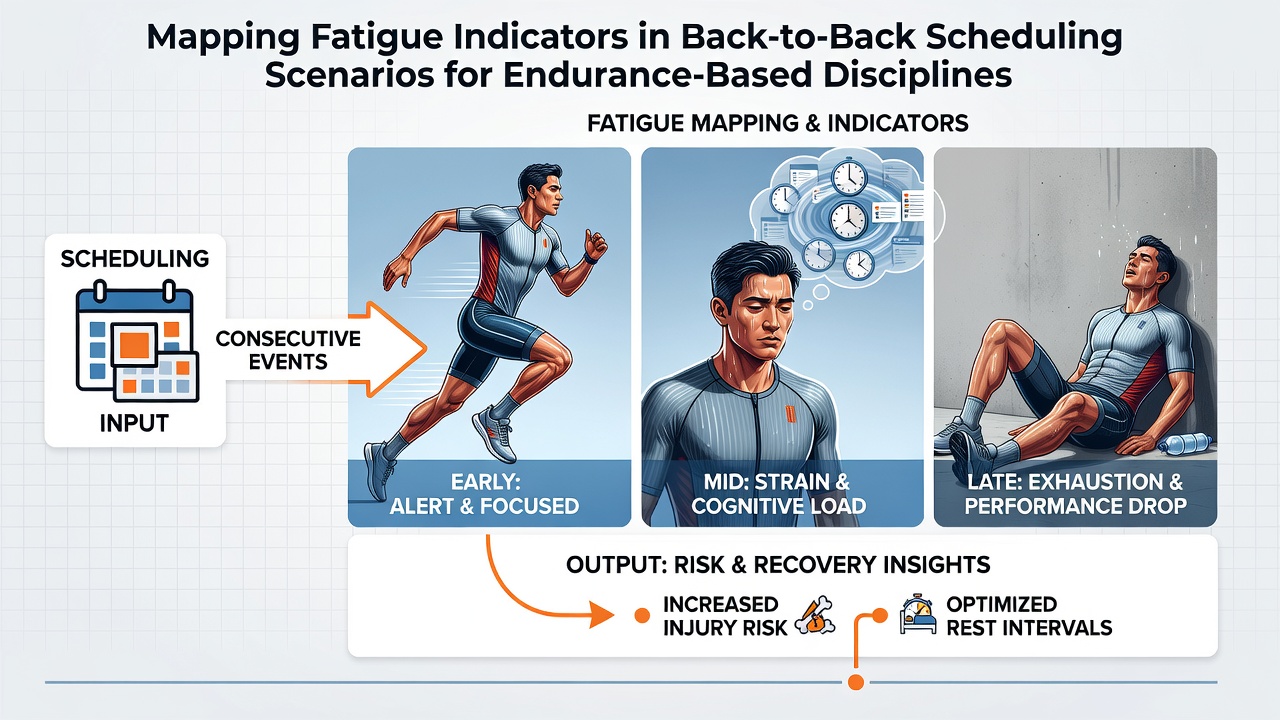
Observations from July 2026 Competition Windows
During July 2026, several major endurance calendars placed athletes in compressed sequences that allowed direct comparison of fatigue trajectories across different recovery protocols. Road cycling grand tours incorporated multiple summit finishes on consecutive stages, and ultra-trail events scheduled back-to-back 100-kilometer races in mountainous terrain. Performance datasets collected during these periods showed that athletes who maintained consistent carbohydrate intake above 90 grams per hour experienced slower deterioration in late-stage power and pace compared with those who fell below that threshold.
Integration with Training and Competition Planning
Coaches use fatigue maps to adjust session intensity or insert recovery rides when indicators cross predetermined alert levels, and teams often share anonymized datasets with sports science departments to refine periodization models. National federations in several countries have begun requiring standardized monitoring protocols for athletes entering multi-day selection trials, which creates larger pooled datasets for future analysis. These practices help identify individual response profiles rather than applying uniform recovery timelines across entire squads.
Conclusion
Mapping fatigue indicators across back-to-back scheduling scenarios supplies endurance disciplines with objective frameworks for anticipating performance shifts and tailoring recovery interventions. Continued collection of physiological and performance data from events such as those observed in July 2026 supports refinement of these models, allowing researchers and practitioners to better understand how consecutive high-load exposures interact with individual recovery capacity.