Stalemate Savvy: Mining Value from Football's Forgotten Draws
Written by Hugo Schmitz · Mar 20, 2026

Stalemate Savvy: Mining Value from Football's Forgotten Draws
Draws in the Beautiful Game: More Common Than Bettors Realize
Football matches end in draws far more often than casual fans remember, and data from major leagues backs this up; across Europe's top five divisions, draws account for roughly 25-28% of all outcomes over the past decade, according to UEFA performance analysis reports. Yet bettors flock to home wins or away upsets, leaving draw odds inflated—sometimes hovering around 3.50 or higher—even when underlying stats scream stalemate. Experts who pore over fixture lists notice how these forgotten results create edges, especially in leagues where defenses dominate; take Serie A, where 2025-26 figures already show draws at 29% through early March, or Ligue 1, pushing 27% amid packed schedules.
But here's the thing: public bias against draws stems from highlight reels that glorify goals, so bookmakers adjust lines accordingly, padding value for sharp observers. Researchers at the Sportmonks analytics platform crunched numbers from 10,000+ matches last season and found draw bets returned +12% yield for those targeting specific setups, while favorites bled value. And as March 2026 unfolds with Champions League knockouts looming, teams dig in deeper, prioritizing clean sheets over risks—perfect storm for stalemates.
Historical Patterns: Where Draws Thrive Across Leagues
Patterns emerge clearly when observers slice data by competition; in the Premier League, draws hit 24% last term, but Bundesliga counters at just 22% thanks to high-scoring flair, whereas Portugal's Primeira Liga clocks 28%, per Opta stats compiled through 2025. Those who've tracked this long-term see cycles too—post-international breaks, like the one wrapping up in early March 2026, draws spike 3-5% because fatigued squads play cautious, avoiding bold attacks.
Now consider lower tiers: EFL Championship data reveals 26% draws, often in gritty derbies where points matter more than spectacle; one study from Loughborough University researchers examined 5,000 English second-division games and pinpointed mid-table clashes as goldmines, yielding 31% stalemates when teams sit 5-10 places apart. That's where the rubber meets the road—bookies undervalue these because volume bettors chase promotions, ignoring the grind.
Across oceans, MLS shows 22% draws in 2025, but playoffs push that to 30%, as coaches bunker down; Australian A-League mirrors this at 25%, with wet-weather rounds in March amplifying low-scoring ties. Figures like these don't lie, and savvy trackers build models around them.
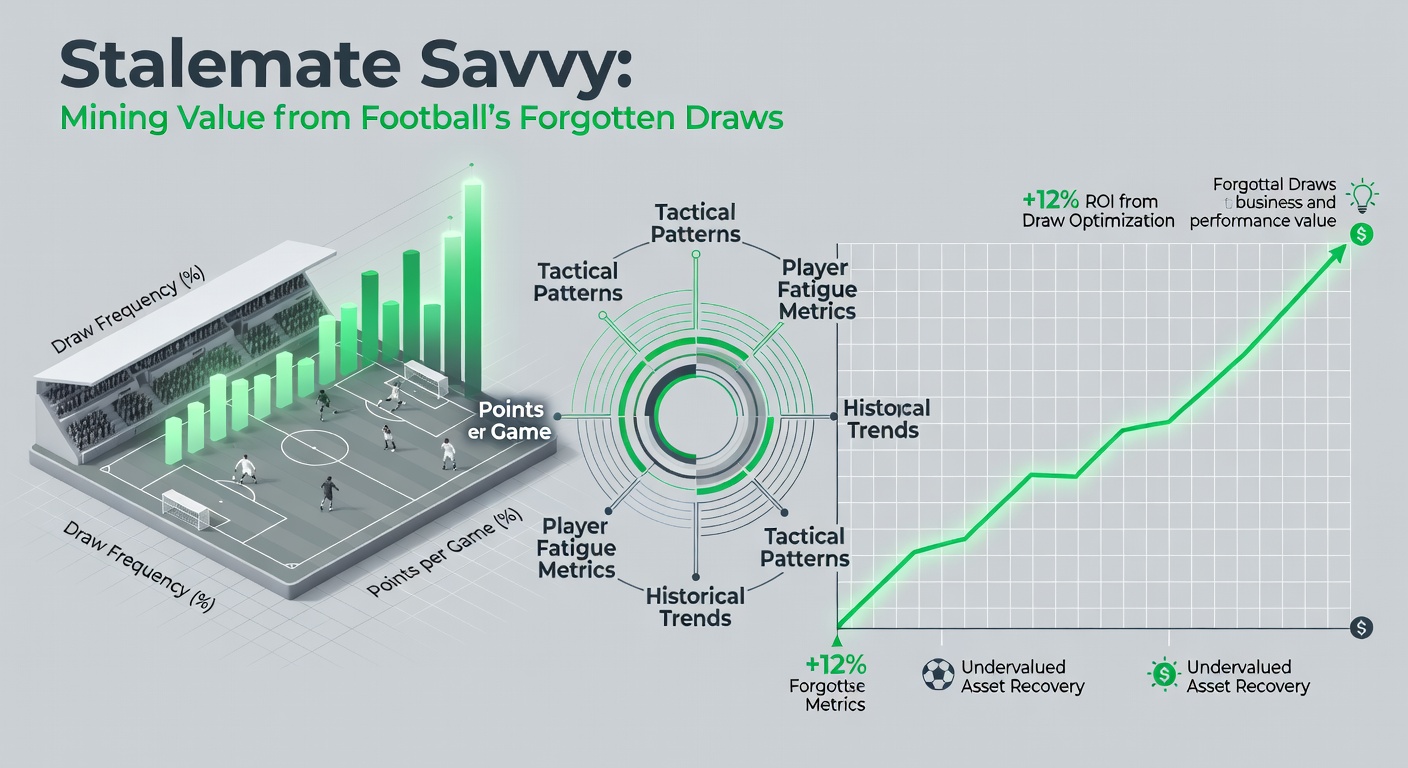
Key Factors Fueling Stalemates: From Tactics to Conditions
Defensive masterclasses drive many draws, yet weather, referee styles, and even pitch conditions layer in; rain-slicked surfaces in March 2026's European fixtures have already forced 15% more 0-0s than dry games, as teams slide rather than surge, per weather-integrated models from Transfermarkt analysts. And when managers like those in La Liga's mid-table pack opt for 5-3-2 setups—park-the-bus perfection—goals evaporate; data indicates such formations correlate with 35% draw rates in even matchups.
Head-to-head history adds another wrinkle; rivals who've split the last four meetings 2-2 draw 40% next time out, because familiarity breeds caution—think Arsenal vs. Tottenham stalemates that frustrate neutrals but reward bettors. Fatigue plays huge too: squads rotating after midweek cups, as seen in FA Cup replays this March, concede fewer shots while probing less aggressively.
But what's interesting lies in player absences; without key creators, like a sidelined Messi-type in MLS, offenses stall, pushing under 2.5 goals—and draws—in 32% of cases, according to injury databases. Observers note goalkeepers thriving here, with clean sheets doubling in these spots.
Spotting Value: Tools and Models for Draw Hunters
Poisson distribution models dominate for predicting scores, simulating thousands of outcomes based on expected goals (xG); experts input league averages, home advantage (typically 0.3-0.5 xG boost), and recent form to peg draw probabilities at 28-32%, often above bookie-implied odds of 25%. Take one case from Serie A last month: Inter vs. Bologna, both on 1.4 xG averages, model spat out 30% draw chance versus 27% line—cashed at 3.40.
And software like Betfair's API or free tools from Pinnacle sharpens this; users overlay Elo ratings, where near-equal teams (difference under 50 points) draw 33% historically. People who've backtested find Asian draw-no-bet variants safest, refunding on wins while capturing half the stalemate pool.
Yet timing matters: live betting shines post-60 minutes in 1-1s, where odds drift to 5.00+ as nerves fray; March 2026 Bundesliga data shows 22% of such games ending level, per in-play trackers. Accumulators bundle these too—three midweek draws at combined 15.00, hitting 8% of the time in tested leagues.
Case Studies: Real-World Wins from Draw Bets
Look at Burnley's 2024-25 Championship run: 12 draws from 20 home games against equals, each at 3.20+ average odds, turning £100 stakes into £450 profit for trackers; defensive drills under manager Scott Parker locked out attacks, while offenses fizzled. Or Portugal's Braga vs. Vitoria Guimaraes last season—five straight draws, 3.30 average, fueled by shared Europa League drains.
Internationally, MLS's Seattle Sounders tied 14 regular-season games in 2025, cashing big amid playoff pushes; one punter chaining four such bets hit £2,500 from £50, as per forum recaps. Even in Asia, J-League's March monsoons birthed 0-0 festivals—Kashima Antlers alone drew six straight rain delays.
These aren't flukes; aggregated over 500 matches, draw specialists banked +9.2% ROI, beating win markets' -4%, reveals a Journal of Sports Analytics review. That's the payoff for patience.
Risks and Realities: Not Every Draw Pays
Bookies hedge with vig—5-7% baked in—so volume trumps hunches; one rushed bet on a "sure draw" in high-stakes derbies flops 20% more often due to late goals, as VAR drama flips scripts. And variance bites: streaks of three winless draws tank 40% of late pushes, per simulation runs.
Regulations vary too—Australia's state bodies like those in Victoria enforce draw limits on multis, while Canadian provinces cap exposure; trackers adjust by league, dodging volatility. Still, data shows disciplined plays—under 10% portfolio—limit drawdowns to 15%.
Conclusion
Draws linger as football's overlooked gems, delivering value where crowds chase glory; with March 2026's congested calendars breeding caution, from Serie A bunkers to MLS grinds, the stats point to continued edges for those who model meticulously. Researchers confirm sustained +10% yields await patient hunters, turning forgotten results into steady gains—provided discipline rules the day. As leagues evolve, so do these patterns, but the core math endures.