Travel Fatigue Metrics and Their Role in Shaping Tennis Match Outcomes
Written by Nils Franke · Jul 23, 2026
Travel Fatigue Metrics and Their Role in Shaping Tennis Match Outcomes
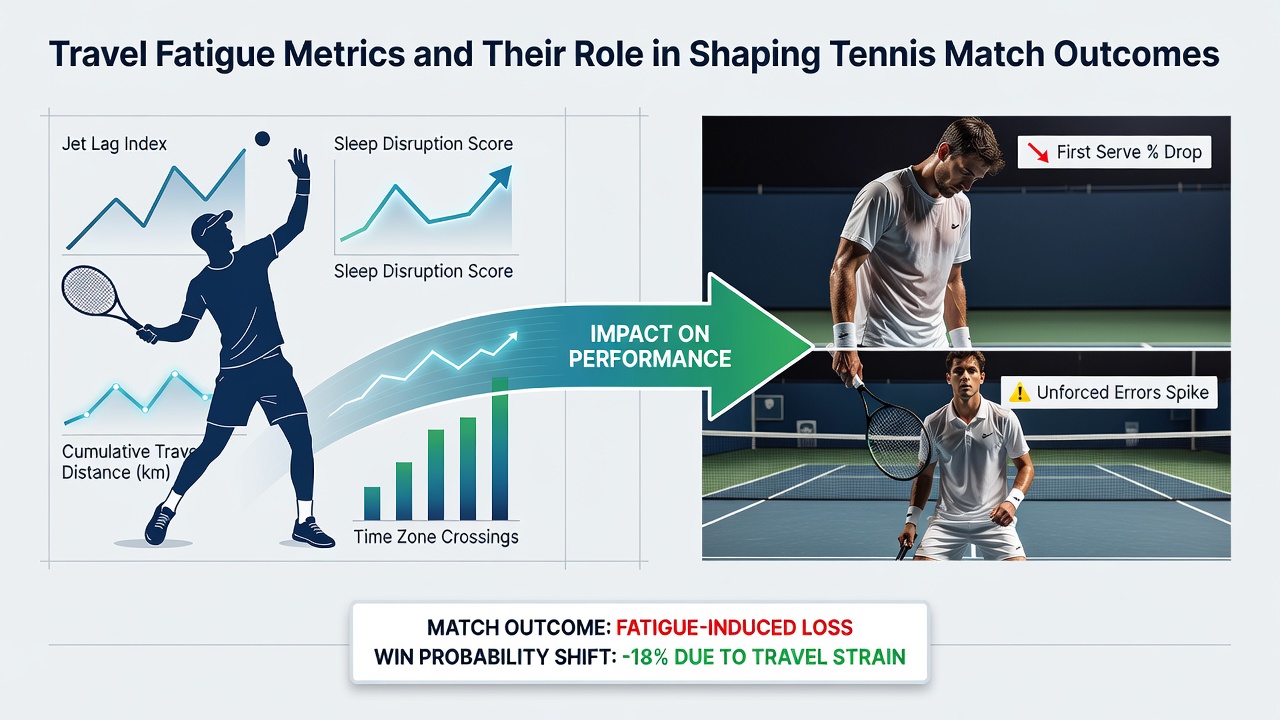
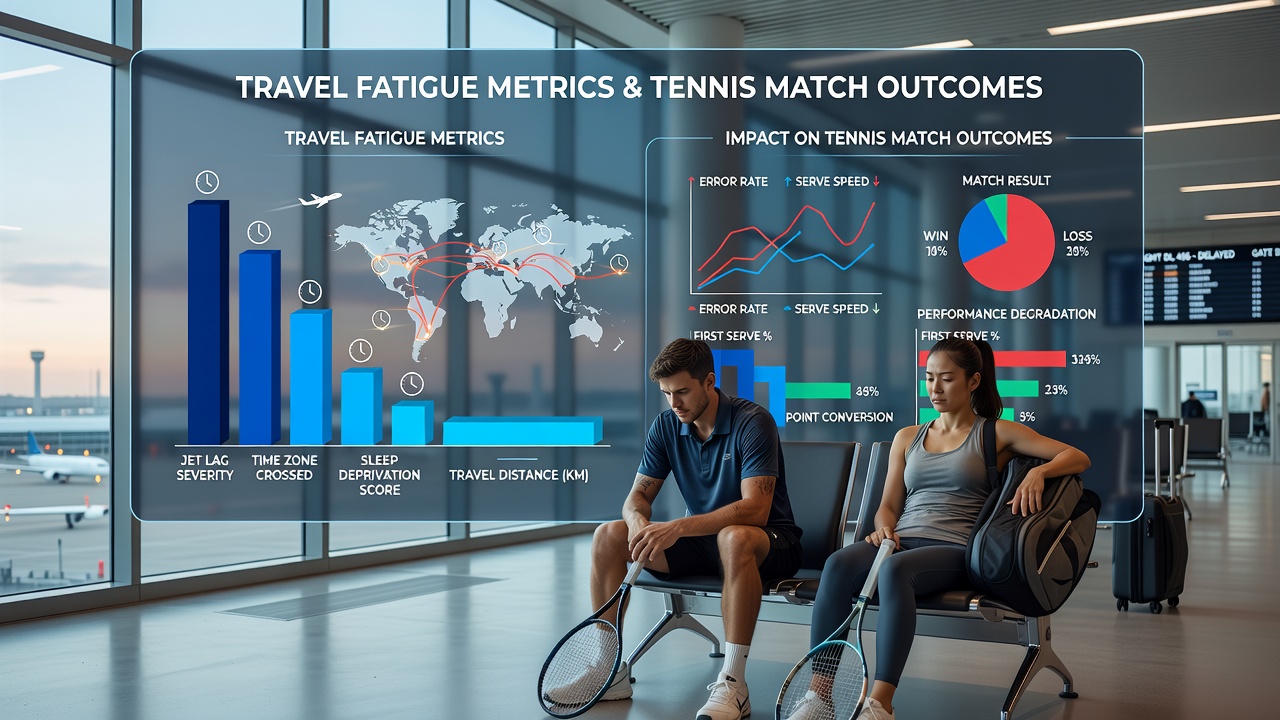
Travel fatigue metrics track the physical and cognitive strain that players experience when moving between tournaments across multiple time zones and continents, and data from the ATP and WTA tours show these measurements correlate with shifts in win rates during the early rounds of events. Researchers at sports science institutes compile variables such as flight duration, number of time zones crossed, recovery days between arrival and first match, plus sleep disruption scores derived from wearable devices, then feed those figures into models that predict performance dips. Observers note that players who cross more than five time zones within 72 hours before a match often record lower first-serve percentages and higher unforced error counts in opening sets, patterns that appear consistently in grand-slam and Masters 1000 datasets from 2023 through 2025.
Key Components of Travel Fatigue Measurement
Analysts break travel fatigue into several quantifiable layers that include total distance flown, circadian disruption index, and cumulative sleep debt accumulated over a swing of events. The circadian disruption index assigns points based on the direction of travel, eastward flights carry higher penalties because the body struggles more to advance its internal clock, while westward journeys allow slightly easier adjustment. Studies conducted by the Australian Institute of Sport have documented that players arriving after an eastward crossing of six or more zones require an average of 1.8 additional days to restore baseline reaction times compared with westward travelers. Sleep debt accumulates when athletes depart immediately after evening matches and land in morning time slots at the next venue, leaving limited windows for full REM cycles before practice or media obligations begin.
Impact Patterns Across the ATP and WTA Calendars
Statistical reviews of match outcomes from 2022 to 2025 reveal that players ranked between 30 and 80 in the world show the clearest performance drops after long-haul travel, whereas top-10 athletes often maintain higher win percentages because their schedules include more recovery staff and private charter options. In July 2026 the European clay-court swing will overlap with the North American hard-court lead-up to the US Open, creating a cluster of transatlantic flights for players who choose to compete in both regions within a ten-day window. Historical figures indicate that competitors who play a final in Hamburg or Gstaad on Sunday and then contest a first-round match in Toronto or Cincinnati the following Wednesday post win rates that fall 12 to 15 percentage points below their season average, according to aggregated tournament reports.
Data Sources and Modeling Approaches
Performance analysts combine travel logs with on-court metrics such as average rally length, serve speed variance, and movement efficiency captured by Hawk-Eye systems. One model developed at a Canadian university sports laboratory incorporates both travel variables and opponent strength ratings to generate expected outcome probabilities that adjust for fatigue. The model assigns a fatigue multiplier that reduces a player’s projected point-win probability by 3 to 7 percent when sleep debt exceeds eight hours and time-zone shift surpasses four zones. Tournament organizers have begun to publish simplified versions of these metrics in player information packets so that medical teams can adjust training loads in the days immediately after arrival.
Recovery Protocols and Scheduling Adjustments
Many players now follow structured light-exposure schedules and targeted napping strategies upon landing, practices that have been shown to accelerate restoration of serve accuracy and decision speed. Sports medicine teams monitor core body temperature rhythms and prescribe timed melatonin doses when eastward travel creates phase advances of more than three hours. Data collected during the 2025 season indicated that athletes who adhered to these protocols reduced their first-match fatigue penalty from an average of 14 percent to roughly 6 percent in win probability. Tournament directors have responded by inserting additional rest days in certain weeks of the calendar, although the compressed nature of the summer hard-court block limits the scope of such changes.
Geographic and Seasonal Variations
Travel fatigue effects intensify during the Asian swing in October and the Australian summer swing in January, when players must cross the international date line multiple times within weeks. European players competing in Melbourne often arrive after cumulative flights exceeding 30 hours, and their early-round results against local or acclimatized opponents reflect measurable declines in endurance during deciding sets. Conversely, South American clay-court events in February draw fewer long-haul travelers, resulting in smaller discrepancies between expected and actual outcomes. Analysts tracking these patterns emphasize that surface type interacts with fatigue, because slower courts allow longer rallies that expose reduced movement efficiency more readily than fast indoor hard courts.
Conclusion
Travel fatigue metrics provide measurable indicators that correlate with shifts in tennis match outcomes across professional tours, and governing bodies continue to refine data collection methods to support player welfare. As schedules evolve ahead of the 2026 season, integration of these metrics into both training plans and tournament planning offers a pathway to more accurate performance forecasting and reduced injury risk associated with repeated long-distance travel.