What Fixture Density Reveals About Potential Results in Mid Season Football Markets
Written by Zoe Schwarz · Aug 27, 2026
What Fixture Density Reveals About Potential Results in Mid Season Football Markets
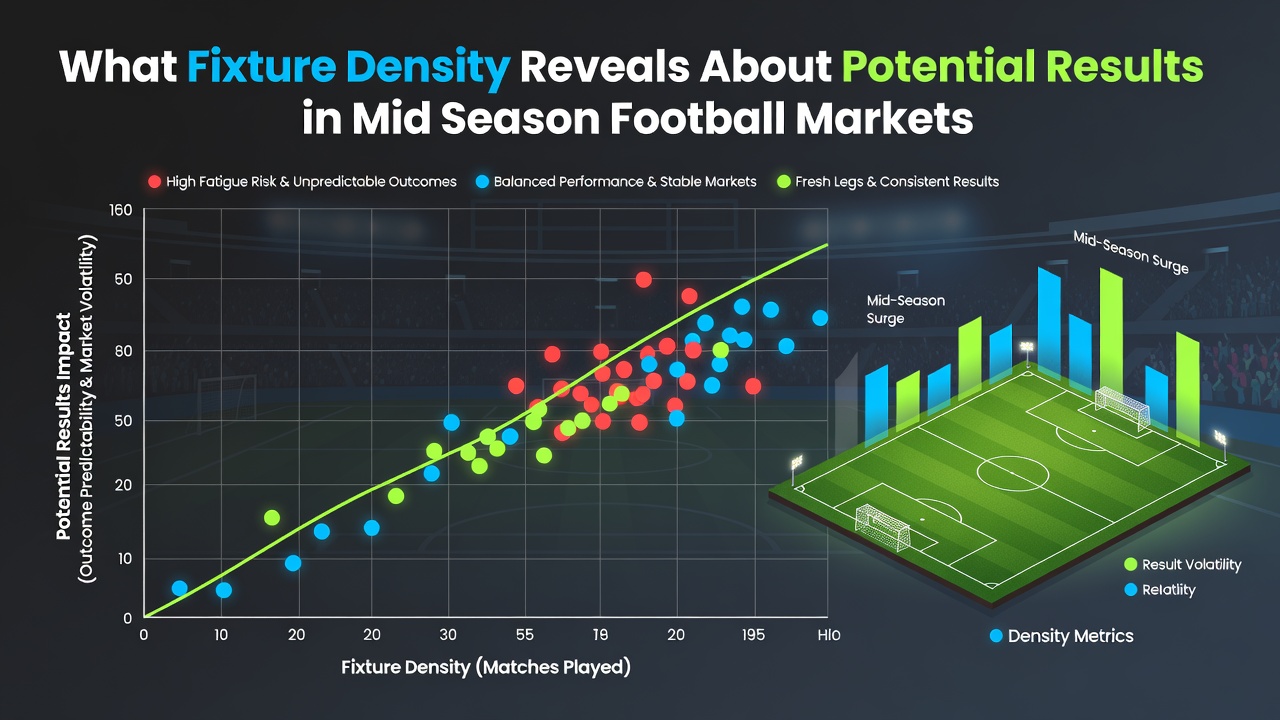
Fixture density in football refers to the concentration of matches within short time frames, and data from multiple leagues shows how this pattern influences outcomes during the middle portion of the season, which typically runs from November through February in most European competitions. Observers note that teams often face three or four games in ten days around this period, and statistical models track the resulting shifts in scoring rates and draw percentages.
Patterns in Congested Schedules
Researchers have tracked how teams with fewer rest days between fixtures post different results compared to those with longer recovery periods, and figures from the 2024-2025 campaigns indicate a measurable drop in goals per game when average rest falls below four days. European leagues provide clear examples where clubs juggling domestic cups and continental ties show increased reliance on draws, while total goals decline by roughly 0.3 per match on average according to aggregated league data. Analysts point out that this occurs because player workload accumulates, which affects sprint distances and defensive organization in later stages of matches.
Market Implications for Betting Outcomes
Betting markets respond to these density patterns through adjustments in over-under lines and draw odds, and historical datasets reveal that under totals hit at higher rates during peak congestion windows in leagues such as Serie A and teh Bundesliga. Studies from sports science groups demonstrate that injury incidence rises 18 to 22 percent in squads playing every third day, which in turn correlates with lower expected goals for both sides. One analysis of the 2025-2026 mid-season window found that teams coming off European matches covered less high-intensity distance in domestic fixtures, producing fewer shots on target and pushing markets toward lower-scoring outcomes. Observers note that bookmakers incorporate these workload metrics when setting prices, creating identifiable edges for those monitoring fixture lists released in late summer windows like August 2026.
Regional Variations Across Leagues
Leagues in different regions display distinct responses to fixture density, and data from CONCACAF competitions shows wider margins in results when travel compounds the schedule pressure, whereas European domestic leagues tend toward tighter scorelines. A report issued by the European Commission on sport and physical activity highlights how squad rotation strategies mitigate some effects, yet teams with thinner benches still post higher draw frequencies. Australian researchers examining A-League schedules found similar patterns, with congested periods leading to elevated foul counts and more bookings, which influences both player props and team totals in betting exchanges. These variations allow market participants to compare leagues side by side rather than treating all fixtures uniformly.
Statistical Indicators and Workload Metrics
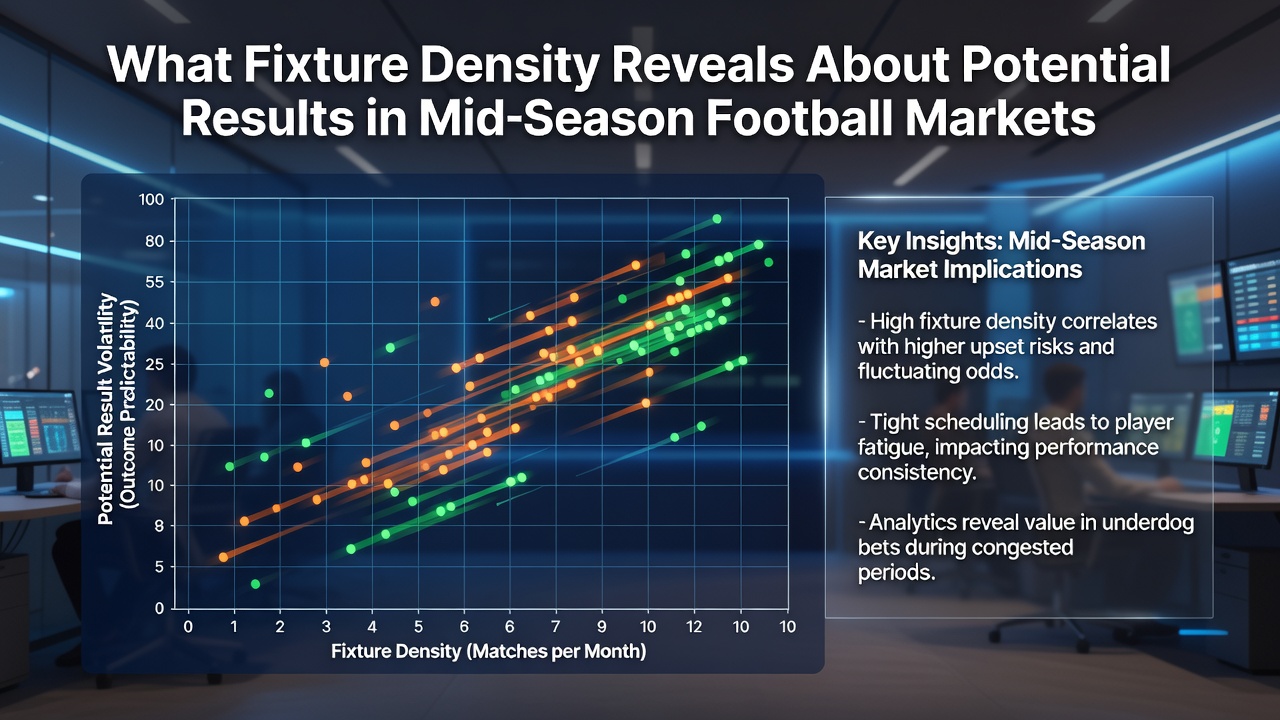
Advanced tracking systems now provide granular details on distance covered and recovery heart rates, and these inputs feed into predictive models used by analysts to forecast mid-season results. Figures compiled by university research teams indicate that teams averaging under 72 hours rest between matches win approximately 12 percent fewer games than expected based on pre-season odds. External factors such as weather and pitch conditions amplify these effects, while international breaks in October and November sometimes reset the cycle before the densest stretch begins. People who follow these metrics closely observe that early-season preparation in August 2026 influences how clubs manage later congestion, because squads that build deeper benches during the transfer window maintain performance levels more consistently.
Case Examples from Recent Seasons
Take the 2024-2025 Premier League period where several clubs played six matches in eighteen days, and results showed an uptick in 1-1 and 0-0 scorelines compared to the season average. Similar clusters appeared in Ligue 1 during the same window, where defensive setups became more prevalent and total goals per game dipped below the long-term mean. Observers tracking these clusters note that the pattern repeats across seasons when the calendar packs qualifiers and league games together, creating repeatable signals for those examining historical data rather than subjective impressions.
Conclusion
Fixture density serves as a measurable variable that shapes mid-season football results across multiple markets, and the evidence from league statistics, workload studies, adn regional comparisons demonstrates consistent directional impacts on scoring, draws, and win rates. Those monitoring these patterns gain access to structured data points that align with observable outcomes rather than isolated events.